Performance Tuning
Abstract
Performance does not come without a price. And the optimization process is more like a journey finding the balance between cost, security and performance.
After the system is up and running, there is something need to tweak according the workload to achieve better performance.
You could use sysctl -w key=value or write to the proc fs, after that, validate the system behaves as you expected, if yes, then you may write the configuration to /etc/sysctl.conf
Table of Contents
- Abstract
- Table of Contents
- Methodology
- Monitoring & Benchmarking
- Analyzing System Performance
- Generic Tuning
- Infrastructure
- CPU
- Memory
- Disk I/O
- File System
- Networking
- Resource Limits
- References
Methodology
The USE Method
- Utilization
- Saturation
- Errors
  Saturation
[] [] [] [] []   ---------------
-------------->  |             |
                 | Utilization |
   o o x o o     |             |
<-------------   ---------------
    Errors
Resource Types
- I/O Resources
- Capacity Resources
Software Resources
- Mutex Locks
- Thread Pools
- Process/Thread Capacity
- File Descriptor Capacity
Monitoring & Benchmarking
Data Collection
classic time window:
- high peak under pressure
- random duration under normal pressure
The proc File System
System Monitor
Command-line Tools
- top
- vmstat
- uptime/w
- ps, pstree
- free
- total: physical memory - (s small bit that the kernel permanatly reserved for itself at startup)
- used: memory in use by the OS
- free: memory not in use
- total = used (shared, buffers, cached, …) + free
- -/+ buffers/cache: used - (buffers + cached)/free + (buffers + cached)
- cached
- result of completed I/O operations
- tmpfs
- …
- iostat (I/O bound)
- system I/O device loading
- sar
- CPU
- sar -u -P ALL -f /var/log/sa/sa24
- asr -q -P ALL -f …
- swap: sar -S
- memory: sar -{R,r}
- task queue: sar -q
- network: sar -n DEV
- CPU
- mpstat (CPU bound)
- numastat
- memory statistics for processes and the operating system on a per-NUMA node basis
- numad
- an automatic NUMA affinity management daemon
- pmap
- netstat
- netstat -i
- netstat -s
- ss
- statistics information about sockets
- ss -s
- ip
- ip -s link
- tcpdump/ethtool
- strace
- optional install
- iptraf
- nmon
- iotop
- dstat
- turbostat
- Intel Trubo Boost Tech
- processor topology, frequency
- idle power-stat, statistics
- temperature, power usage
- irqbalance
- distributes hardware interrupts accross processors to improve system performance
Application Profilers
SystemTap
Tuning and probing, more deeper, more precise
DTrace
mysql-5.7.11/support-files/dtrace
OProfile
A system-wide performance monitoring tool
Valgrind
Detection and profiling tools to help improve performance of application
Perf
- A profiler tool for Linux 2.6+
- Based on the perf events interfaces exported by Linux kernel
Perf data sources:
- hardware performance counters
- enable performance counter for virtual machine
- kernel tracepoints
Becnmark Tools
netperf/iperf/iometer/ttcp/ab/Apache Jmeter/bonnie
Load Generator
Monitor Performance
Monitor System Utilization
Reporting
Analyzing System Performance
Steps:
- known the system (gather system information)
- backup
- monitor and analying the system’s performance
- narrow down the bottleneck and find its cause
- fix the bottleneck cause by trying one change at a time
- go back to step 3 until satisfied with the performance
Incase of
- positive false
- negative false
Generic Tuning
- tuned-adm
- a number of different profiles optimized for different workloads to maximize the performance respectively
[root@rhel.vmg will]# tuned-adm list
Available profiles:
- balanced
- desktop
- latency-performance
- network-latency
- network-throughput
- powersave
- throughput-performance
- virtual-guest
- virtual-host
Current active profile: network-latency
Infrastructure
schematic interaction of different performance componenets
-----------------------------------------------------
|                  Applications                     |
|---------------------------------------------------|
| Libraries |                                       |
|---------------------------------------------------|
|                                                   |
|  Kernel                                           |
|                      -----------------------------|
|                      |          Drivers           |
|            ---------------                        |
|            |   Firmware  |                        |
|---------------------------------------------------|
|                     Hardware                      |
|---------------------------------------------------|
CPU
Frequency
Configure kernel tick time
setting hardware performance policy
Scheduling
process life cycle
   ------------------              wait()               ------------------
-> | parent process |- - - - - - - - - - - - - - - - - >| parent process | ->
   ------------------                                   ------------------
          |                                                   ^
          | fork()                                            |
          v                                                   |
   ------------------  exec()  -----------------  exit() ------------------
   |  child process |--------->| child process |-------->| zombie process |
   ------------------          -----------------         ------------------
- orphan process
- a process that is still executing, but whose parent has died. These do not remain as zombie processes; instead, (like all orphaned processes) they are adopted by init (process ID 1), which waits on its children. The result is that a process that is both a zombie and an orphan will be reaped automatically.
process priority
- static
- -20 ~ 19
- nice, renice
- requires root privilege to increse
- dynamic
context switch
- the context of the running process is stored
- and the context of the next running process is restored to the registers
The process descriptor and the area are called kernel mode stack.
Process State
- TASK_RUNNING
- running or waiting to run in the queue (run queue)
- TASK_STOPPED
- suspended by certain signals (SIGINT, SIGSTOP), waiting to be resumed by a signal such as SIGCONT
- TASK_INTERRUPTIBLE
- suspended and wait for a certain condition to be satisfied (example, waiting for keyboard input)
- TASK_UNINTERRUPTIBLE
- sending a signal does nothing to the process in this state (example, waiting for disk I/O)
- TASK_ZOMBIE
- the process is waiting for its parent to be notified to release all the data structure. processes in this state could not be killed, could kill its parent instead
                                                  ---------------
                                                  | TASK_ZOMBIE |
                                                  ---------------
                                                        ^
                                                        |
    fork()                                            exit()
       |                                                ^
       v                                                |
----------------           scheduling           ------------------
| TASK_RUNNING |  ----------------------------> | TASK_RUNNING   |
|    (READY)   |  <---------------------------- | (on processor) |
----------------           preemption           ------------------
       ^                                                v
       |                                                |
       |<----------<   TASK_STOPPED          <----------|
       |<----------<   TASK_INTERRUPTIBLE    <----------|
       |<----------<   TASK_UNINTERRUPTIBLE  <----------|
Schedule Policies
-
Realtime policies
defines a fixed priority (1 ~ 99) for each thread
- SCHED_FIFO
- referred to as static priority scheduling
- SCHED_RR
- a round-robin variant of the SCHED_FIFO
- threads with the same priority are scheduled round-robin style within a certain quantum, or time slice:
sched_rr_get_interval(2) - but the duration of the time slice cannot be set by a user
- this policy is useful if you need multiple thread to run at the same priority
- SCHED_FIFO
-
Normal policies
Both SCHED_BATCH and SCHED_IDLE are intended for very low priority jobs, and as such are of limited interest in a performance tuning topic.
- SCHED_OTHER, or SCHED_NORMAL
- use Completely Fair Scheduler (CFS) to provide fair access periods for all threads using this policy
- CFS establishes a dynamic priority list partly based on the niceness value of each process thread
- this gives users some indirect level of control over process priority
- but the dynamic priority list can only be directly changed by the CFS
- SCHED_BATCH
- SCHED_IDLE
- SCHED_OTHER, or SCHED_NORMAL
Affinity
- setting process affinity with
taskset - managing NUMA affinity with
numactl - automatic NUMA affinity management with
numad
Isolate CPUs: isolacpus boot parameter, prevent any user space threads on these CPUs
Tuna can isolate a CPU at any time
Interrupts and IRQ
/proc/interrupts
- soft
- hard
Binding interrupts to a single physical processor could improve system performance.
setting interrupts affinity: /proc/irq/irq_number/smp_affinity
NUMA
Configuring CPU, thread, and interrupt affinity with Tuna
Performance Metrics
- CPU Utilization
- User Time
- Depicts the CPU percentage spent on user process, including nice time
- System Time
- IRQ and softing time
- High and sustained system time values can point bottlenecks in the network and driver stack
- A system should spent as little time as possible in kernel time
- Waiting
- Total amount of time spent waiting for an I/O operation to occur
- A system should not spend too much time waiting for I/O operation
- Idel Time
- Nice Time
- Depicts the CPU percentage spent on re-nicing processes that change the execution order and priority of processes
- Load Average
- The load average is not a percentage, but the rolling average of the sum of the following:
- the number of processes in queue waiting to be processed
- the number of processes waiting for uninterruptible task to complete
- This is the average of the sum of TASK_RUNNING and TASK_UNINTERRUPTIBLE processes
- The load average is not a percentage, but the rolling average of the sum of the following:
- Runnable Processes
- processes that are ready to be executed
- should not exceeds 10 times of the amount of physical processors for a sustained peroid of time
- Blocked
- waiting for I/O operation to finish
- Context Switches
- Amount of switches between threads that occur on the system context switches generally are not desirable because the CPU cache is flushed with each one, but some are necessary
- Interrupts
- Contains hard and soft ones
- Hard interrupts have a more adverse effect on system performance
- Interrupts value includes the interrupts caused by the CPU clock
Tuning
- Tuning process priority
- nice
- renice
- CPU affinity for interrupt handling
- bind processes that cause a significant amount of interrupts to a CPU
- Let physical processors handle interrupts
- Considerations for NUMA systems
- numastat
- /sys/devices/system/node/{nodenum}/numastat
- NUMA affinity
Memory
Memory Management
-----------------------------------------------------------------------------
|                           physical memory                                 |
|---------------------------------------------------------------------------|
|            page-level allocator                |      space for kernel    |
|------------------------------------------------|                          |
|  KMA(kernel memory allocator) | paging system  | * codes                  |
|-------------------------------|----------------|                          |
| * net buffer                  | * user process | * static data structures |
| * procfs                      | * block cache  |                          |
| * inodb,file handle           |                |                          |
-----------------------------------------------------------------------------
Process Memory Segments
process address space
----------------------------------0x00
|               Text                 |
| Executable instructions (Read Only)|
|------------------------------------|---->
|               Data                 |    |
|         Initialized Data           |    |
|------------------------------------|    |
|                BSS                 |     > Data Segment
|       Zero-Initialized Data        |    |
|------------------------------------|    |
|               Heap                 |    |
|           Dynamic Memory           |    |
|        Allocated by malloc()       |    |
|------------------------------------|---->
|                                    |
|------------------------------------|
|              Stack                 |
|       * Local Variables            |
|       * Function Parameters        |
|       * Return Address, etc        |
--------------------------------------
pmap- report memory map of a process
Performance Metrics
- Free memory
- substract the amount of buffers and cache from the used memory to determine (effectively) free memory
- Swap usage
- swap in/out is a reliable means of identifying a memory bottleneck
- Buffer and cache
- cache allocated as file system and block device cache
- Slabs
- depicts the kernel usage of memory
- note that the kernel page could not be paged out to disk
- Active vs inactive memory
- provides information about the active use of the system memory
- inactive memory is a likely candidate to be swapped out to disk by the kswapd daemon
Considerations
Page Size
- default 4KB
- static huge page <= 1GB
- transparent huge page 2MB
Transaltion Lookaside Buffer (TLB) size
- HugeTLB
- allow memory to be managed in very large segments
Monitoring and Diagnosing Performance Probes
monitoring memroy usage: vmstat
Huge Pages
Profiling
Profiling application memory usage with Valgrind
Valgrind
Memcheck (Memory Usage)
Cachegrind (Cache Usage)
Massif (Heap and Stack Space)
Configure
- huge pages /proc/sys/vm/nr_hugepages
- system memory capacity
- dirty_ratio
- dirty_background_ratio
- overcommit_memory
- overcommit_ratio
- max_map_count
Others
- min_free_kbytes
- oom_adj
- swappiness
Capacity
Virtual Memory
# Do less swapping
vm.swappiness = 10
vm.dirty_ratio = 60
vm.dirty_background_ratio = 2
Tuning
/proc/sys/vm
setting kernel swap and pdflush behavior
- /proc/sys/vm/swappiness
- can be used to define how aggressively memory pages are swapped to disk
- /proc/sys/vm/dirty_background_ratio
- defines at what percentage of main memory the pdflush daemon should write data out to the disk
- /proc/sys/vm/dirty_ratio
- defines at what level the actual disk writes will take place
- this value is a percentage of main memory
Swap partition
Linux also uses swap space to page memory areas to disk that have not been used for a significant amount of time
HugeTLBfs
This memory management feature is valuable for applications that use a large virtual memory address space. It is especially useful for database applications.
The CPU’s Translation Lookaside Buffer (TLB) is a small cache used for storing virtual-to-physical mapping information.
For simplicity, this feature is exposed to applications by means of a file system interface.
Disk I/O
Architecture
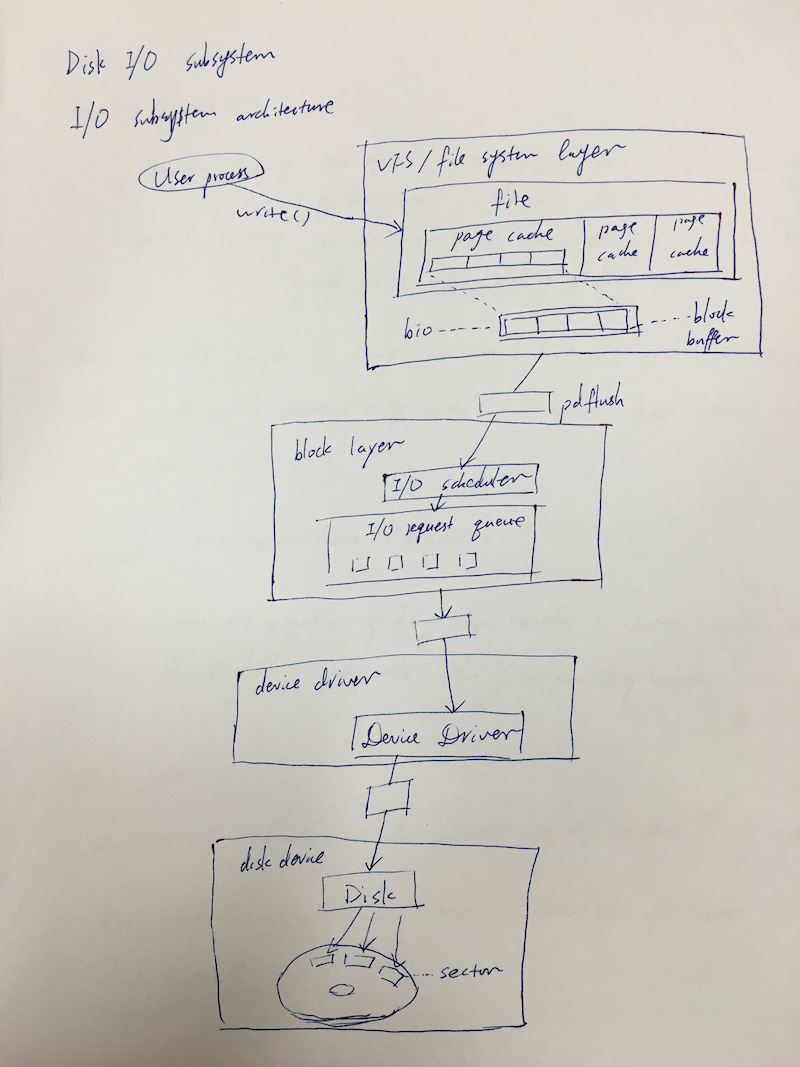
Block I/O on Linux
                      File I/O          File I/O
User Space                ^                 ^
--------------------------|-----------------|---------------------
Kernel Space              |                 |
                  --------v-----------------v--------
                  | Virtual File System (VFS) Layer |
                  -----------------^-----------------
                                   |
       ----------------------------v---------------------------
       | Individual File Systems (ext3, ext4, XFS, VFAT, ...) |
       ----------------------------^---------------------------
                                   |
               --------------------v-------------------
               |       Buffer Cache (Page Cache)      |
               --------------------^-------------------
                                   |
               --------------------v-------------------
               |             I/O Schedulers           |
               |--------------------------------------|
               |    cfq   /   deadline   /    noop    |
               -------^----------------------^---------
        Request Queue |                      | Request Queue
               -------v--------        ------v---------
               | Block Driver |        | Block Driver |
               -------^--------        ------^---------
Kernel Space          |                      |
----------------------|----------------------|--------------------
Storage Media         |                      |
                      v                      v
                  ----------            ------------
                  |  Disk  |            | CD-Drive |
                  ----------            ------------
Cache
- Locality of reference
- temporal locality
- the data most recently used has a high probablity of being used in the near future
- spartial locality
- the data that resides close to the data which has been used has a high probablity of being used
- temporal locality
Linux use this principle in many conponments such as page cache, file object cache (i-node cache, directory entry cache, etc), read ahead buffer and more.
pdflush
pdflush runs
- on a regular basic (kupdate)
- when the proportion of dirty buffers exceeds a certain threhold (bdflush), the threhold is configurable in the /proc/sys/vm/dirty_background_ratio (5 by default)
Block Layer
The block layer handles all the activity related to the block device operation
bio is the key data structure, an interface between the file system layer and the block layer)
- Block size
- the smallest amount of data that can be read or written to a drive, can have a direct impact on a server’s performance. Reformat is needed to change the block size.
Scheduler
The I/O scheduler are now selectable on a per-disk basis.
- noop
- No Operation, simple and lean
- a simple FIFO queue that does not perform any data ordering
- simply merges adjacent data requests
- assumes that a block device either
- features its own elevator algorithm such as TCQ for SCSI
- or that the block device has no seek latency such as a flash card
- often the best choice for memory-backed block devices (e.g. ramdisks) and other non-rotational media (flash) where trying to reschedule I/O is a waste of resources
- deadline
- a cycle elevator (round robin) with a deadline algorithm that provides a near real-time behavior of the I/O system
- a lightweight scheduler which tries to put a hard limit on latency
- offers excellent request latency while maintaining good disk throughput
- ensures that starvation of a process cannot happen
- better for solid state disks (SSD)
- cfq (Completely Fair Queuing)
- implements a QoS policy for processes by maintain per-process I/O queues
- tries to maintain system-wide fairness of I/O bandwidth
- aggresively attempts to avoid starvation of processes and features low latency
- well suited for large multi-user systems with a lot of competing processes
- better for physical spinning storage devices
- can slowdown a single main application (e.g. database)
To set a specific scheduler, simply do this:
echo SCHEDNAME > /sys/block/DEV/queue/scheduler
where SCHEDNAME is the name of a defined IO scheduler, and DEV is the device name (hda, hdb, sga, or whatever you happen to have).
The list of defined schedulers can be found by simply doing
a cat /sys/block/DEV/queue/scheduler - the list of valid names
will be displayed, with the currently selected scheduler in brackets:
# cat /sys/block/hda/queue/scheduler
noop deadline [cfq]
# echo deadline > /sys/block/hda/queue/scheduler
# cat /sys/block/hda/queue/scheduler
noop [deadline] cfq
I/O Device Driver
The Linux kernel takes control of devices using a device driver. The device driver is usually a separate kernel module and and is privided for each device (or group of devices) to make the device available for the Linux OS.
Performance Metrics
- iowait
- time the CPU spends waiting for an I/O operation to occur
- average queue length
- amount of outstanding I/O requests
- in general, a disk queue of 2~3 is optimal
- average wait
- a measurement of the average time in ms it takes for an I/O request to be serviced
- the wait time consists of the actual I/O operation and the time it waited in the I/O queue
- transfer per second (read and write per second)
- the transfer per second metric in conjunction with the KBytes/s value helps to identify the average transfer size of the system
- the average transfer size should match with the strip size used by the disk system
- blocks read/write per second
- expressed in blocks of 1024 bytes as of kernel 2.6
- kilobytes per second read/write
Tuning
Enable asynchronous I/O and Direct I/O support
- libaio
- provides a native Linux asynchronous I/O api
Tuning Async I/O:
aio-nr- shows the current system-wide number of asynchronous io requests
aio-max-nr- allows change the maximum value
aio-nrcan grow to
- allows change the maximum value
/proc/sys/fs/epollmax_user_watches
File System
Overview
- Btrfs
- Global File System 2
- Network File System
- FS-cache
File Hierarchy Standard (FHS)
Virtual File System
- VFS
- is an abstraction interface layer that resides between the user process and various types of Linux file system implementations.
VFS provides common object models (such as i-node, file object, page cache, directory entry, etc) and methods to access file system objects.
VFS concepts
------------
User Process -< cp
------------
     ^
     |
     v
-----------
System Call -< open(), read(), write()
-----------
     ^
     |
     v
----------
    VFS     -< translation foreach file system
----------
     ^
     |
     v
---------------------------------------
 ext2 | NFS | ext3 | VFAT | XFS | proc
---------------------------------------
Journaling Concepts
write
- write journal logs
- make changes to actual file system
- delete journal logs
-----------------------------------
| Journal Area |    File System   |
-----------------------------------
Formatting Options
Mount Options
Profiling
File System Formats
ext4
XFS
- extend-based file system
- if possible, files extent allocation map stored in its inode
- stripe geometry
- su : strip unit (chunk size)
- sw : strip width (number of strip in the strip)
- default atime behavior is relatime
- size option
- reduce: not supported
- enlarge: xfs_growfs
- write barriers
- ensure file system integerity
- nobarrier applies if
- without write cache
- battery-backend
- delayed allocation
- reduce fragmentation
- increse performance
- XFS support extended attributes for files
- direct I/O -> DMA
- high throughput
- non-cached I/O
- external XFS Journals
- SSD
- -logdev=device,size=size
- allocation groups
- virtual storage regions of fixed size
----------------
allocation group
----------------
      |
      v
-------------------
* own set of inodes
* free space
-------------------
      |
      v
------------------
* scalability
* parallelism I/O
------------------
fs.file-max = 2097152
Above setting is specified for system-wide configuration. For user, there is a configure item in /etc/security/limits.conf named nofile, which means max number of open file descriptors.
prlimit and ulimit can be used to inspect the limit:
ulimit -<H|S>n
or
prlimit -n
Networking
See performance-tuning-networking for more detail
Resource Limits
ulimit provides control over resources available to each user via a shell. You can type ulimit -a to get a list of all current settings. In parentheses you will see one or two items: the units in measurements (e.g. kbytes, blocks, seconds) as well as a letter option (e.g. -s, -t, -u). The letter option will let you view/edit one particular setting at a time.
ulimit -S -aview all soft limitsulimit -H -aview all hard limits-
ulimit -S [option] [number]set a specific soft limit for one variablee.g. ulimit -S -s 8192 set a new soft stacksize limit, “-s” is for stack
-
ulimit -H [option] [number]set a specific hard limit for one variablee.g. ulimit -H -s 8192 set a new hardstacksize limit, “-s” is for stack
-
/etc/security/limits.conffile where you can set soft and hard limits per user or for everyonee.g. Add in the following to
/etc/security/limits.confwill set a soft stacksize of 8192 adn a hard stacksize of unlimited for username “toor”:toor soft stack 8192 toor hard stack unlimited
[root@dns will]# ulimit -a
core file size          (blocks, -c) 0
data seg size           (kbytes, -d) unlimited
scheduling priority             (-e) 0
file size               (blocks, -f) unlimited
pending signals                 (-i) 7823
max locked memory       (kbytes, -l) 64
max memory size         (kbytes, -m) unlimited
open files                      (-n) 1024
pipe size            (512 bytes, -p) 8
POSIX message queues     (bytes, -q) 819200
real-time priority              (-r) 0
stack size              (kbytes, -s) 8192
cpu time               (seconds, -t) unlimited
max user processes              (-u) 7823
virtual memory          (kbytes, -v) unlimited
file locks                      (-x) unlimited
limit type
hard
for enforcing hard resource limits. These limits are set by the superuser and enforced by the Kernel. The user cannot raise his requirement of system resources above such values.
soft
for enforcing soft resource limits. These limits are ones that the user can move up or down within the permitted range by any pre-existing hard limits. The values specified with this token can be thought of as default values, for normal system usage. from
limits.conf(5)
References
man pages
getrlimit(2)setrlimit(2)