Performance Tuning - SystemTap
Introduction
- like dtrace
- aims to supplement the existing suite of Linux monitoring tools
- by providing users with the infrastructure to trake kernel activities.
- more deeper
- more precise
- takes a compiler-oriented approach to generating instrumentation
- Flexibility
- Easy of use
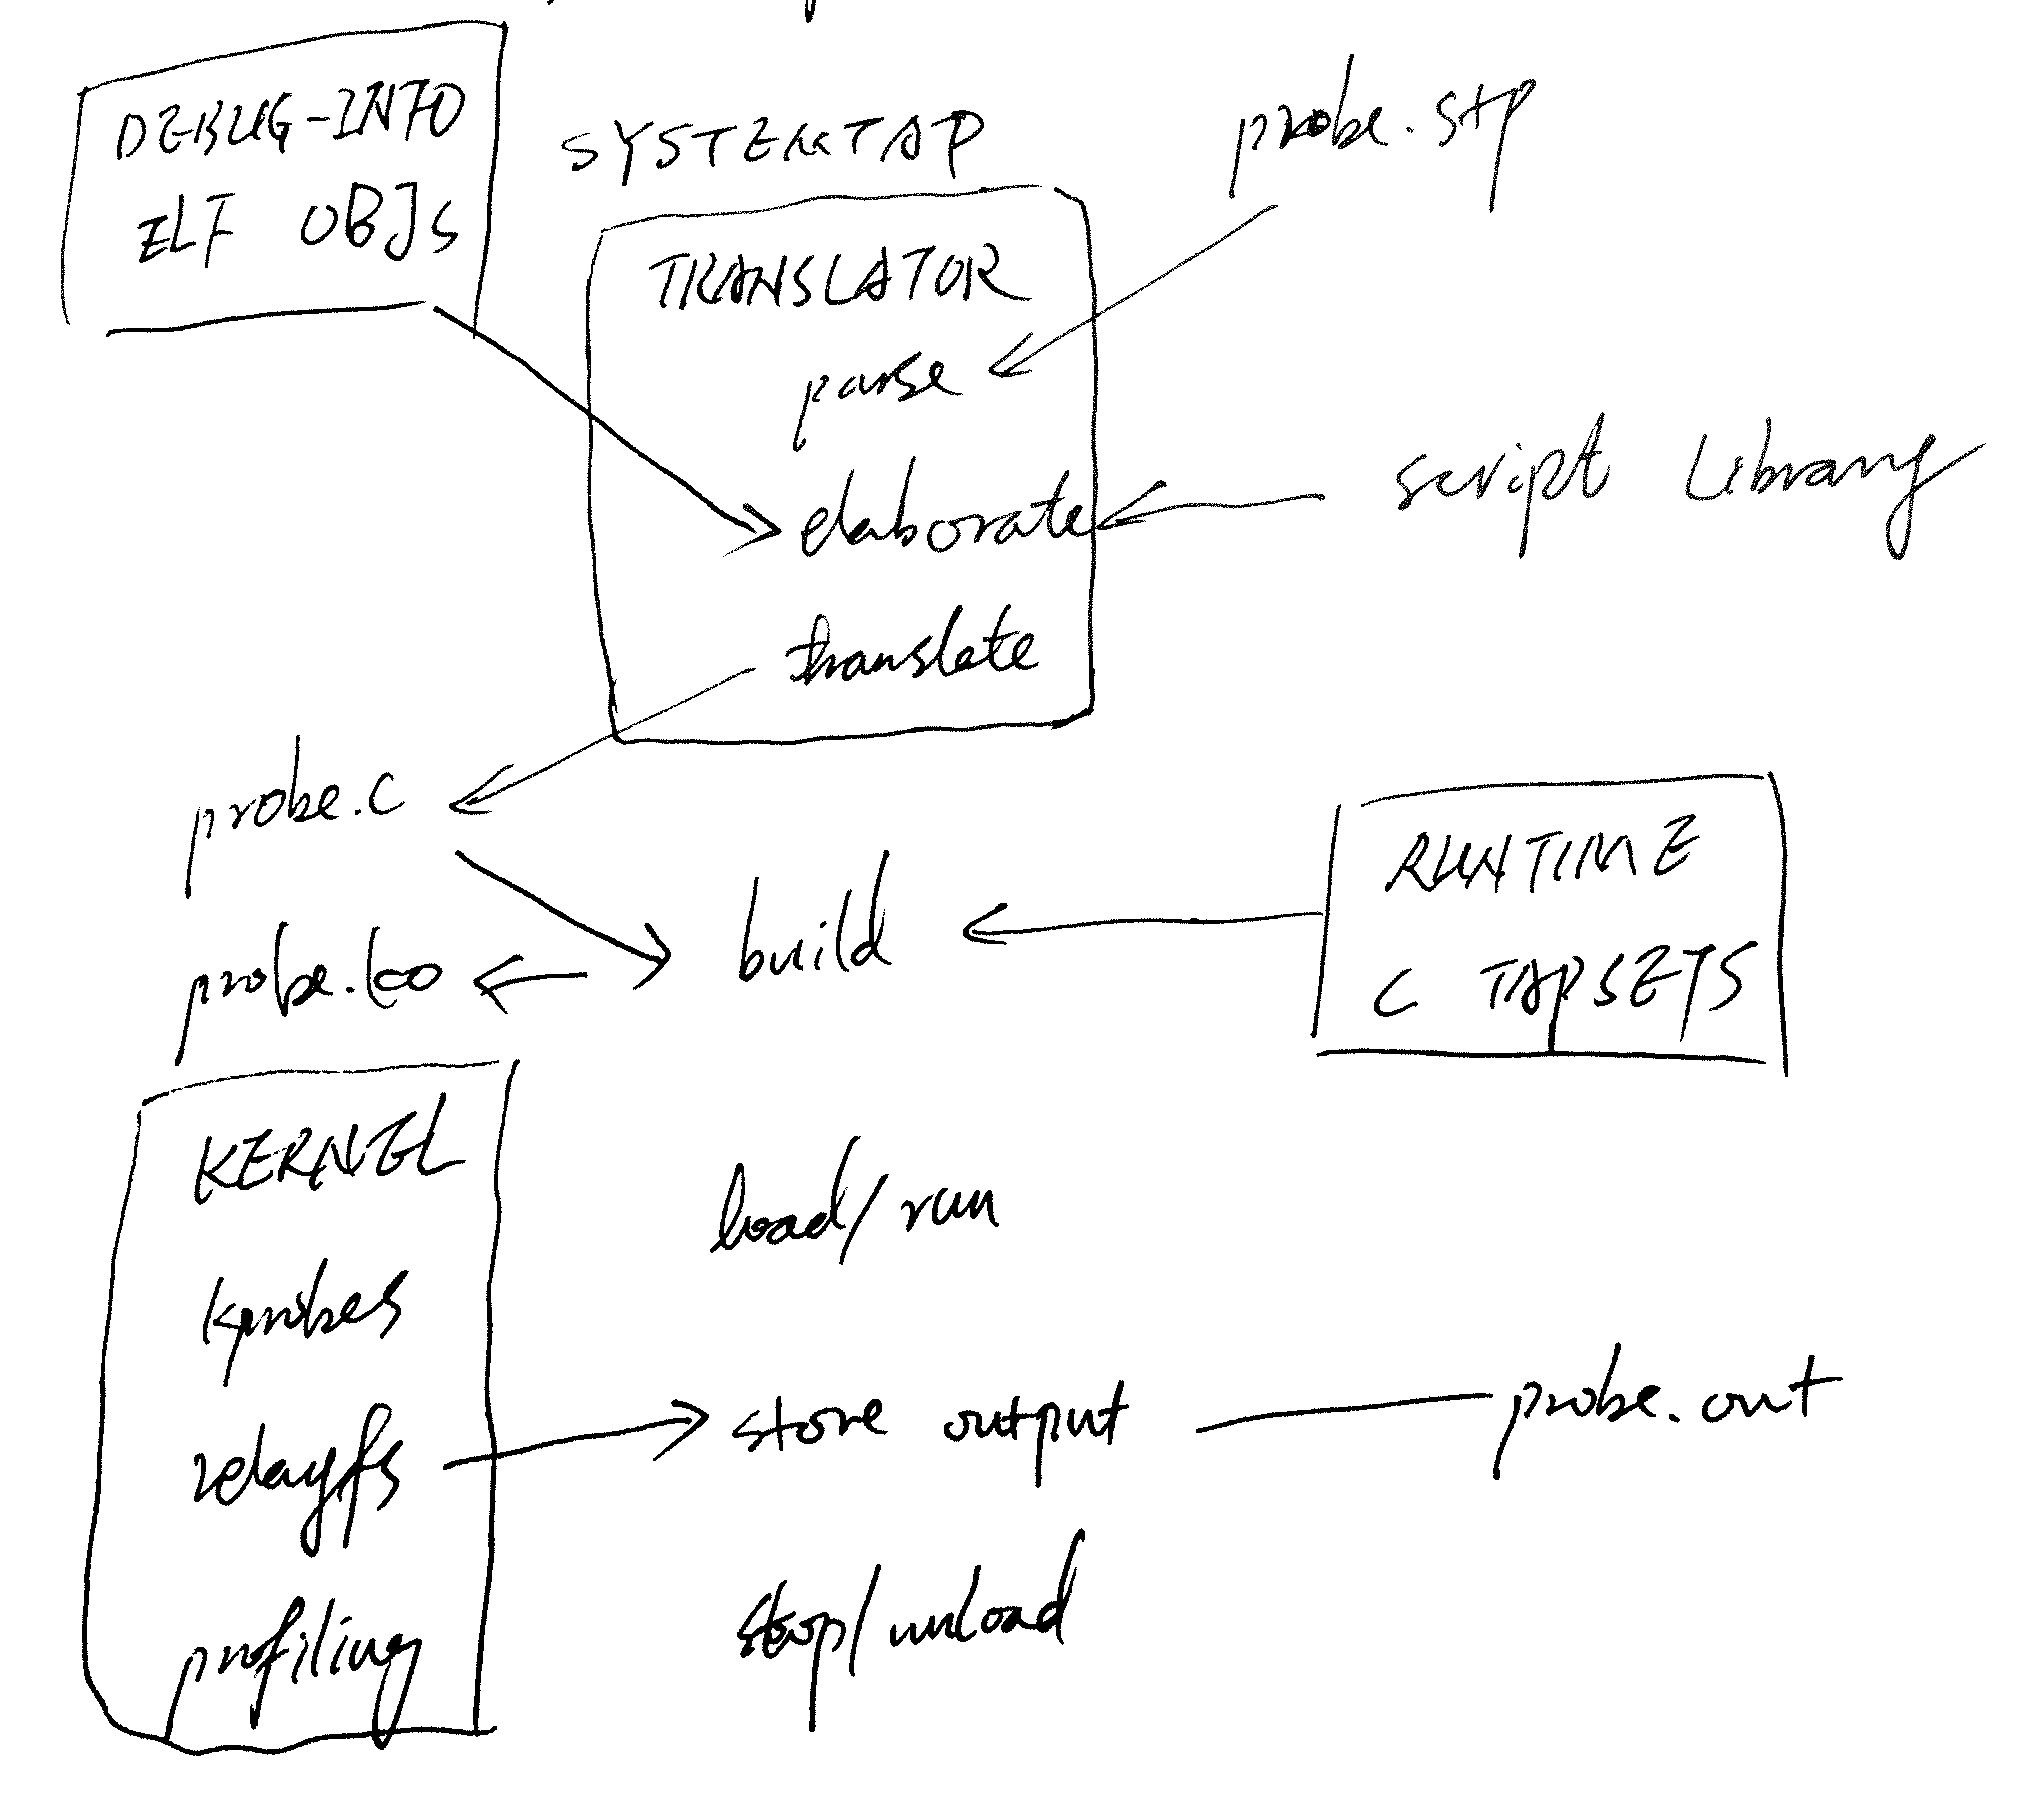
Exec Procedure
- Parse Script
- Analyze Script
- Transalte to C
- Compile C into ko
- Run & Get Output

SystemTap Events
- Synchronous
- syscall.system.call
- vfs.file_operation
- kernel.function(“function”)
- kernel.trace(“tracepoint”)
- module(“module”).function(“function”)
- Asynchronous
- begin
- end
- timer.events
- timer.ms (milliseconds)
- timer.us (microseconds)
- timer.ns
- timer.hz (hertz)
- timer.jiffies
Tapsets
Tapsets are scripts that form a library of pre-written probes and functions to be used in SystemTap scripts.
Usually under /usr/share/systemtap/tapset/
When a user run a SystemTap script, SystemTap checks the script probe events and handlers against the tapset library, SystemTap then loads the corresponding probes and functions before translating into C.